
Automate Reporting with AI: How Agentic Analytics Transforms Enterprise Decision-Making in 2026?


Enterprises are drowning in data but starved for insights. Your team generates hundreds of reports every month. Your analysts spend most of their time building dashboards instead of finding answers. Your executives still wait days for critical information that should take minutes.
This is the reality of traditional business intelligence in 2026. But there is a better way.
The ability to automate reporting with AI is no longer a future dream. It is happening right now.
This guide shows you exactly how automating reporting with AI through agentic analytics transforms enterprise decision making.
What Does Automate Reporting With AI Actually Mean?
When most people hear about ways to automate reporting with AI, they think about scheduled dashboards or automated alerts. That is not what we are talking about here.
True AI powered reporting automation means your system can think, analyze, and act on its own. It goes beyond simple automation to create intelligent systems that understand context, combine multiple data sources, and take action without waiting for human approval.
Traditional reporting follows a simple pattern. You build a dashboard. You schedule it to run weekly. You send it to stakeholders. They look at numbers and try to figure out what happened. This process is slow, manual, and always looking backward.
Modern agentic analytics operates completely differently. The system continuously monitors your data. It detects patterns and anomalies automatically. It investigates root causes by pulling information from multiple sources including emails, documents, and external data. Then it either recommends actions or executes them directly based on predefined rules.
The evolution looks like this:
Stage 1: Static Reporting where analysts manually create reports in Excel or build one time dashboards that quickly become outdated.
Stage 2: Business Intelligence Dashboards where tools like Tableau and Power BI provide real time visualization of structured data from your databases.
Stage 3: Conversational Analytics where you can ask questions in natural language and get answers from your data without writing SQL queries.
Stage 4: Agentic Execution where AI agents autonomously explore data, detect issues, perform multi step analysis, and take actions to solve problems.
This is where enterprises need to be in 2026. The companies that automate reporting with AI using agentic systems will dominate their industries. Those that stick with traditional business intelligence will fall behind.
The Limitations of Traditional BI and Why Enterprises Are Stuck
Traditional business intelligence tools have been the backbone of enterprise reporting for decades. They excel at one thing: visualizing structured data from your databases. But they fail at almost everything else.
Here are the critical problems that prevent traditional BI from delivering real value:
1. Manual Interpretation Required
Your dashboard shows sales dropped 15% last month. Great. But why did it drop? Traditional BI cannot tell you. An analyst must manually investigate. They check different segments. They compare time periods. They talk to regional managers. This takes days or weeks. By the time you understand the problem, the opportunity to fix it has passed.
2. No Insight Into Causation
Traditional BI shows you what happened. It never explains why it happened. You see correlation in your charts, but correlation is not causation. Without understanding root causes, you cannot make informed decisions. You are just guessing based on patterns.
3. Limited to Pre-Modelled KPIs
Business intelligence tools only show metrics that someone has already defined and modelled. If you need a new metric or a different view of your data, you must wait for a data engineer to build it. This creates a massive bottleneck. Business moves faster than your BI team can keep up.
4. Ignores Unstructured Data
Here is the shocking truth: a lot of your enterprise data is unstructured. This includes emails, customer service chats, support tickets, internal documents, meeting notes, and call transcripts. Traditional BI tools completely ignore all of this information.
5. Slow Turnaround Times
Need a new analysis? Submit a ticket to the analytics team. Wait in the queue. Explain your requirements. Wait for the dashboard to be built. Review it. Request changes. Wait again. The entire process takes weeks. In fast moving industries, this delay means missed opportunities and lost revenue.
6. No Proactive Monitoring
Traditional dashboards are passive. They sit there waiting for someone to look at them. They do not alert you when something goes wrong. They do not investigate issues automatically. They do not recommend solutions. They are completely reactive tools that require constant human attention.
The Hidden 80 to 90%: Why You Need Unstructured and External Data
Traditional BI tools cannot handle this data. They only work with structured data sitting in your databases and data warehouses. This means you are building reports and making decisions based on less than 10% of your available information.
Think about what you are missing:
- Customer Intent and Sentiment: Your support tickets contain thousands of customer complaints and feature requests. Your sales emails reveal what prospects actually care about. Your chat logs show where customers get confused. None of this appears in your BI dashboard.
- Operational Context: Your project management documents explain why initiatives failed. Your meeting notes contain crucial decisions and context. Your internal communications reveal employee concerns.
- Market Intelligence: Your competitors are launching new products. Industry regulations are changing. Economic conditions are shifting. Customer preferences are evolving.
- Root Cause Information: When sales drop, the reason is often hidden in unstructured data. Maybe customer service quality has declined. The structured data shows you the symptom. The unstructured data reveals the disease.
Here is what makes this situation even worse. External data matters just as much as internal data, but most enterprises ignore it entirely:
- Competitor Intelligence: What are your competitors doing? What products are they launching? How are customers responding? This information is publicly available but never appears in your reports.
- Market Trends: Industry news, regulatory changes, economic indicators, and technology trends all impact your business. Traditional BI tools do not incorporate any of this information.
- Social Sentiment: What are people saying about your brand on social media? How do customer opinions compare to your competitors? Sentiment analysis provides early warning signals that traditional metrics miss.
- Macro Indicators: Economic data, weather patterns, supply chain disruptions, and geopolitical events can explain sudden changes in your business metrics. Without connecting these dots, you cannot understand why your numbers changed.
What Is Agentic Analytics and Why Does It Change Everything
Agentic analytics represents a fundamental shift in how enterprises use artificial intelligence for decision-making. Instead of AI that simply answers questions, we now have AI that autonomously executes complex multi-step analysis and takes action.
So what exactly is agentic analytics?
An agentic system uses AI agents that operate autonomously to achieve business goals. These agents can perceive their environment, make decisions, take actions, and learn from results. They work independently while following guardrails and governance rules you define.
Here are the key capabilities that make agentic analytics different:
- Autonomous Exploration: The system does not wait for you to ask specific questions. It continuously monitors your data, looking for patterns, anomalies, and opportunities. When it finds something interesting, it investigates automatically.
- Pattern Detection: Advanced algorithms identify trends, correlations, and outliers across massive datasets. The system recognises when something unusual is happening, even if you did not set up an alert for that specific scenario.
- Root Cause Analysis: When metrics change, the agent investigates why. It checks different dimensions of your data. It looks at related metrics. It searches through documents for context. It combines information from multiple sources to identify the underlying cause.
- Multi-Source Integration: Agentic systems pull data from everywhere. Structured databases, unstructured documents, external APIs, real-time feeds, and historical archives. The agent knows how to access each source and combine the information meaningfully.
- Decision Execution: Beyond just providing recommendations, agentic analytics can take action. Update a forecast. Adjust inventory levels. Send alerts to specific teams. Trigger workflows in other systems. The agent executes decisions based on the rules and permissions you define.
- Continuous Learning: The system improves over time. It learns which analyses produce useful insights. It understands which actions lead to better outcomes. It refines its models based on feedback and results.
How Agentic Analytics Helps You Automate Reporting End to End
Now, let us get specific about how agentic analytics actually works in practice. The architecture typically includes several types of specialised agents working together.
- Analytical Agents handle quantitative analysis and forecasting. These agents automatically build reports by pulling data from your databases and running statistical analyses.
For example, an analytical agent monitoring sales performance does not just show you a chart. It automatically identifies that West Coast sales dropped 12% while East Coast sales grew 8%. It calculates that the change is statistically significant. It determines that the drop started exactly 3 weeks ago. Then it investigates why.
- Knowledge Agents process unstructured information. These agents read documents, PDFs, emails, chat logs, and any text based content. They perform semantic search to find relevant information.
When the analytical agent detects that West Coast sales dropped, the knowledge agent searches through customer support tickets, sales call transcripts, and internal communications from that region.
- Agentic Workflow Engine coordinates everything. This system plans multi-step tasks. It decides which agents need to work on a problem. It combines outputs from different agents.
In our sales example, the workflow engine receives the anomaly alert from the analytical agent. It tasks the knowledge agent to investigate. It combines both findings into a root cause report.
- Unified Conversational Layer provides the interface. Instead of navigating complex dashboards, users simply talk to the system in natural language. You can ask followup questions.
You might ask: "Why did our West Coast sales drop?" The system immediately provides the full analysis connecting the sales decline to shipping delays based on customer complaints. You follow up: "How much revenue did we lose?"
Real World Examples: What Automated Reporting Looks Like
Let us walk through concrete examples that show exactly how agentic analytics transforms enterprise reporting.
Example 1: Automated Revenue Reporting
Traditional approach: Your finance team manually pulls data from your ERP system every week. They export it to Excel. They create charts. They email a PDF report to executives.
Agentic approach: Your AI agent automatically monitors revenue data continuously. Every Monday morning, it generates a comprehensive revenue report without human intervention. The report includes:
- Revenue by product line, region, and customer segment
- Comparison to forecast and prior periods
- Automatic highlighting of significant changes
- Root cause analysis for any anomalies
- Customer sentiment analysis from support emails
- Competitive intelligence from external sources
- Specific recommendations for sales leadership
- Automated alerts sent to regional managers for issues requiring attention
An enterprise using this approach reported getting insights 10 times faster compared to their previous manual reporting process.
Example 2: Supply Chain Breakdown Report
Traditional approach: When supply chain issues occur, it takes days to understand what happened. Analysts manually review shipment logs, check vendor contracts, call suppliers, and piece together the story.
Agentic approach: The system continuously monitors IoT sensor data from shipments, reads vendor contracts and performance histories, tracks weather events and traffic disruptions, and monitors news for supply chain impacts. When delays occur, the agent automatically:
- Identifies which shipments are affected
- Determines root causes by correlating internal and external data
- Calculates business impact and customer effects
- Generates a comprehensive risk summary
- Triggers vendor follow up workflows
- Adjusts inventory forecasts
- Alerts affected customers proactively
One manufacturing company reduced their supply chain response time from 3 days to 2 hours using this approach.
Example 3: Marketing Performance Report
Traditional approach: Marketing teams manually compile campaign performance data. They check analytics platforms, social media metrics, and advertising dashboards. They create PowerPoint presentations. They present findings in weekly meetings. The entire process consumes 10+ hours per week and only covers digital channels.
Agentic approach: The system automatically monitors campaign performance across all channels continuously. It reads social media sentiment and competitor activity. Every morning, the marketing team receives:
- Daily performance brief across all channels
- Audience sentiment analysis from social media
- Competitive benchmark comparisons
- Attribution analysis showing which touchpoints drive conversions
- Budget optimisation recommendations
- Automatic campaign adjustments based on performance
Industries that Thrive with AI
AI reporting is revolutionizing the way industries operate by streamlining the reporting process and delivering actionable insights from complex data sets. Sectors such as finance, healthcare, marketing, and sales are at the forefront of this transformation, leveraging advanced AI reporting capabilities and machine learning algorithms to gain a competitive edge.
In finance, AI reporting tools can analyze massive volumes of transactional data in real time, identifying emerging trends, detecting anomalies, and predicting market fluctuations with minimal manual effort. This empowers financial institutions to make data-driven decisions faster and with greater confidence.
Healthcare organizations benefit from AI reporting by integrating and analyzing patient records, lab results, and treatment histories. Machine learning algorithms can uncover patterns in patient data, enabling personalized treatment plans and improving patient outcomes while reducing the administrative burden on staff.
Marketing teams use AI reporting to monitor campaign performance across multiple channels, analyze customer sentiment, and optimize strategies on the fly. By automating the reporting process, marketers receive real time insights that help them adjust campaigns for maximum impact and operational efficiency.
Sales organizations rely on AI reporting tools to track pipeline health, forecast revenue, and identify high-value opportunities. Automated reporting systems synthesize data from CRM platforms, emails, and external sources, providing sales leaders with up-to-date information and actionable recommendations.
Across these industries, AI reporting not only reduces manual effort but also enhances reporting capabilities, enabling organizations to unlock the full value of their data and drive superior business outcomes.
Why Enterprises Are Adopting Agentic Analytics
The benefits of using agentic analytics to automate reporting with AI extend far beyond faster reports. Here are the transformative advantages enterprises are achieving.
- Faster Time to Insight: Speed matters in modern business. A major gaming company saw 10 times faster time to insight after implementing agentic analytics. What used to take days now takes minutes.
- Full Data Utilization: Remember that 80 to 90% of enterprise data is unstructured. Agentic analytics finally lets you use all of it. Your reports incorporate customer emails, support tickets, internal documents, and external intelligence.
- Proactive Instead of Reactive: Traditional reports are historical. They tell you what already happened. Agentic systems are proactive. They detect issues before they become serious problems. They identify opportunities as they emerge.
- Actionable Intelligence: The goal is not just charts and graphs. The goal is action. Agentic analytics provides specific recommendations backed by thorough analysis.
- Lower Analyst Workload: Your data team spends most of their time on repetitive tasks. Building the same reports every week. Answering routine questions. Explaining obvious trends. Agentic analytics handles all of this automatically.
How Agentic Analytics Compares to Traditional BI
Understanding the difference between traditional business intelligence, conversational BI, and agentic analytics helps clarify why this evolution matters.
- Traditional BI platforms like Tableau, Power BI, and Looker provide static dashboards that visualise structured data from your databases. They cannot explain why metrics changed.
- Conversational BI tools add natural language interfaces. Microsoft Power BI Copilot, ThoughtSpot, and similar tools let you ask questions in plain English. The system generates visualisations and answers based on your structured data.
- Agentic analytics platforms operate at a completely different level. They use multiple specialised AI agents that work together. They reason across structured data, unstructured documents, and external sources.
The difference is fundamental. Traditional BI says "here is what happened." Conversational BI says "I can answer your questions about what happened." Agentic analytics says, "I already investigated what happened, I know why it happened, I calculated the impact, and I executed the necessary corrective actions."
Best Practices for AI Reporting
To fully realize the benefits of AI reporting, enterprises should adopt a set of best practices that ensure both the quality and impact of their generated reports. Start by defining clear goals for your AI reporting initiatives—whether it’s boosting operational efficiency, supporting strategic decision making processes, or improving business outcomes.
Integrate multiple data sources to provide a comprehensive view of your operations. High quality data is the foundation of effective AI reporting, so invest in data validation and cleansing to ensure accuracy and reliability. Select AI reporting tools that align with your organization’s needs, offering the right mix of features, scalability, and ease of use.
Empower your team by providing training on how to use AI reporting systems effectively. This helps non-technical users generate insights and interpret generated reports with confidence. Regularly review and refine your AI-generated reports to maintain their relevance and accuracy as your business evolves.
Finally, establish a robust governance framework to oversee your AI reporting processes. This includes setting policies for data access, ensuring compliance with regulatory requirements, and aligning reporting activities with your broader business strategy. By following these best practices, organizations can maximize the value of their AI reporting investments and drive continuous improvement in decision making.
How to Start Using Agentic Analytics to Automate Reporting
Getting started with agentic analytics requires a systematic approach. Here is the roadmap that successful enterprises follow.
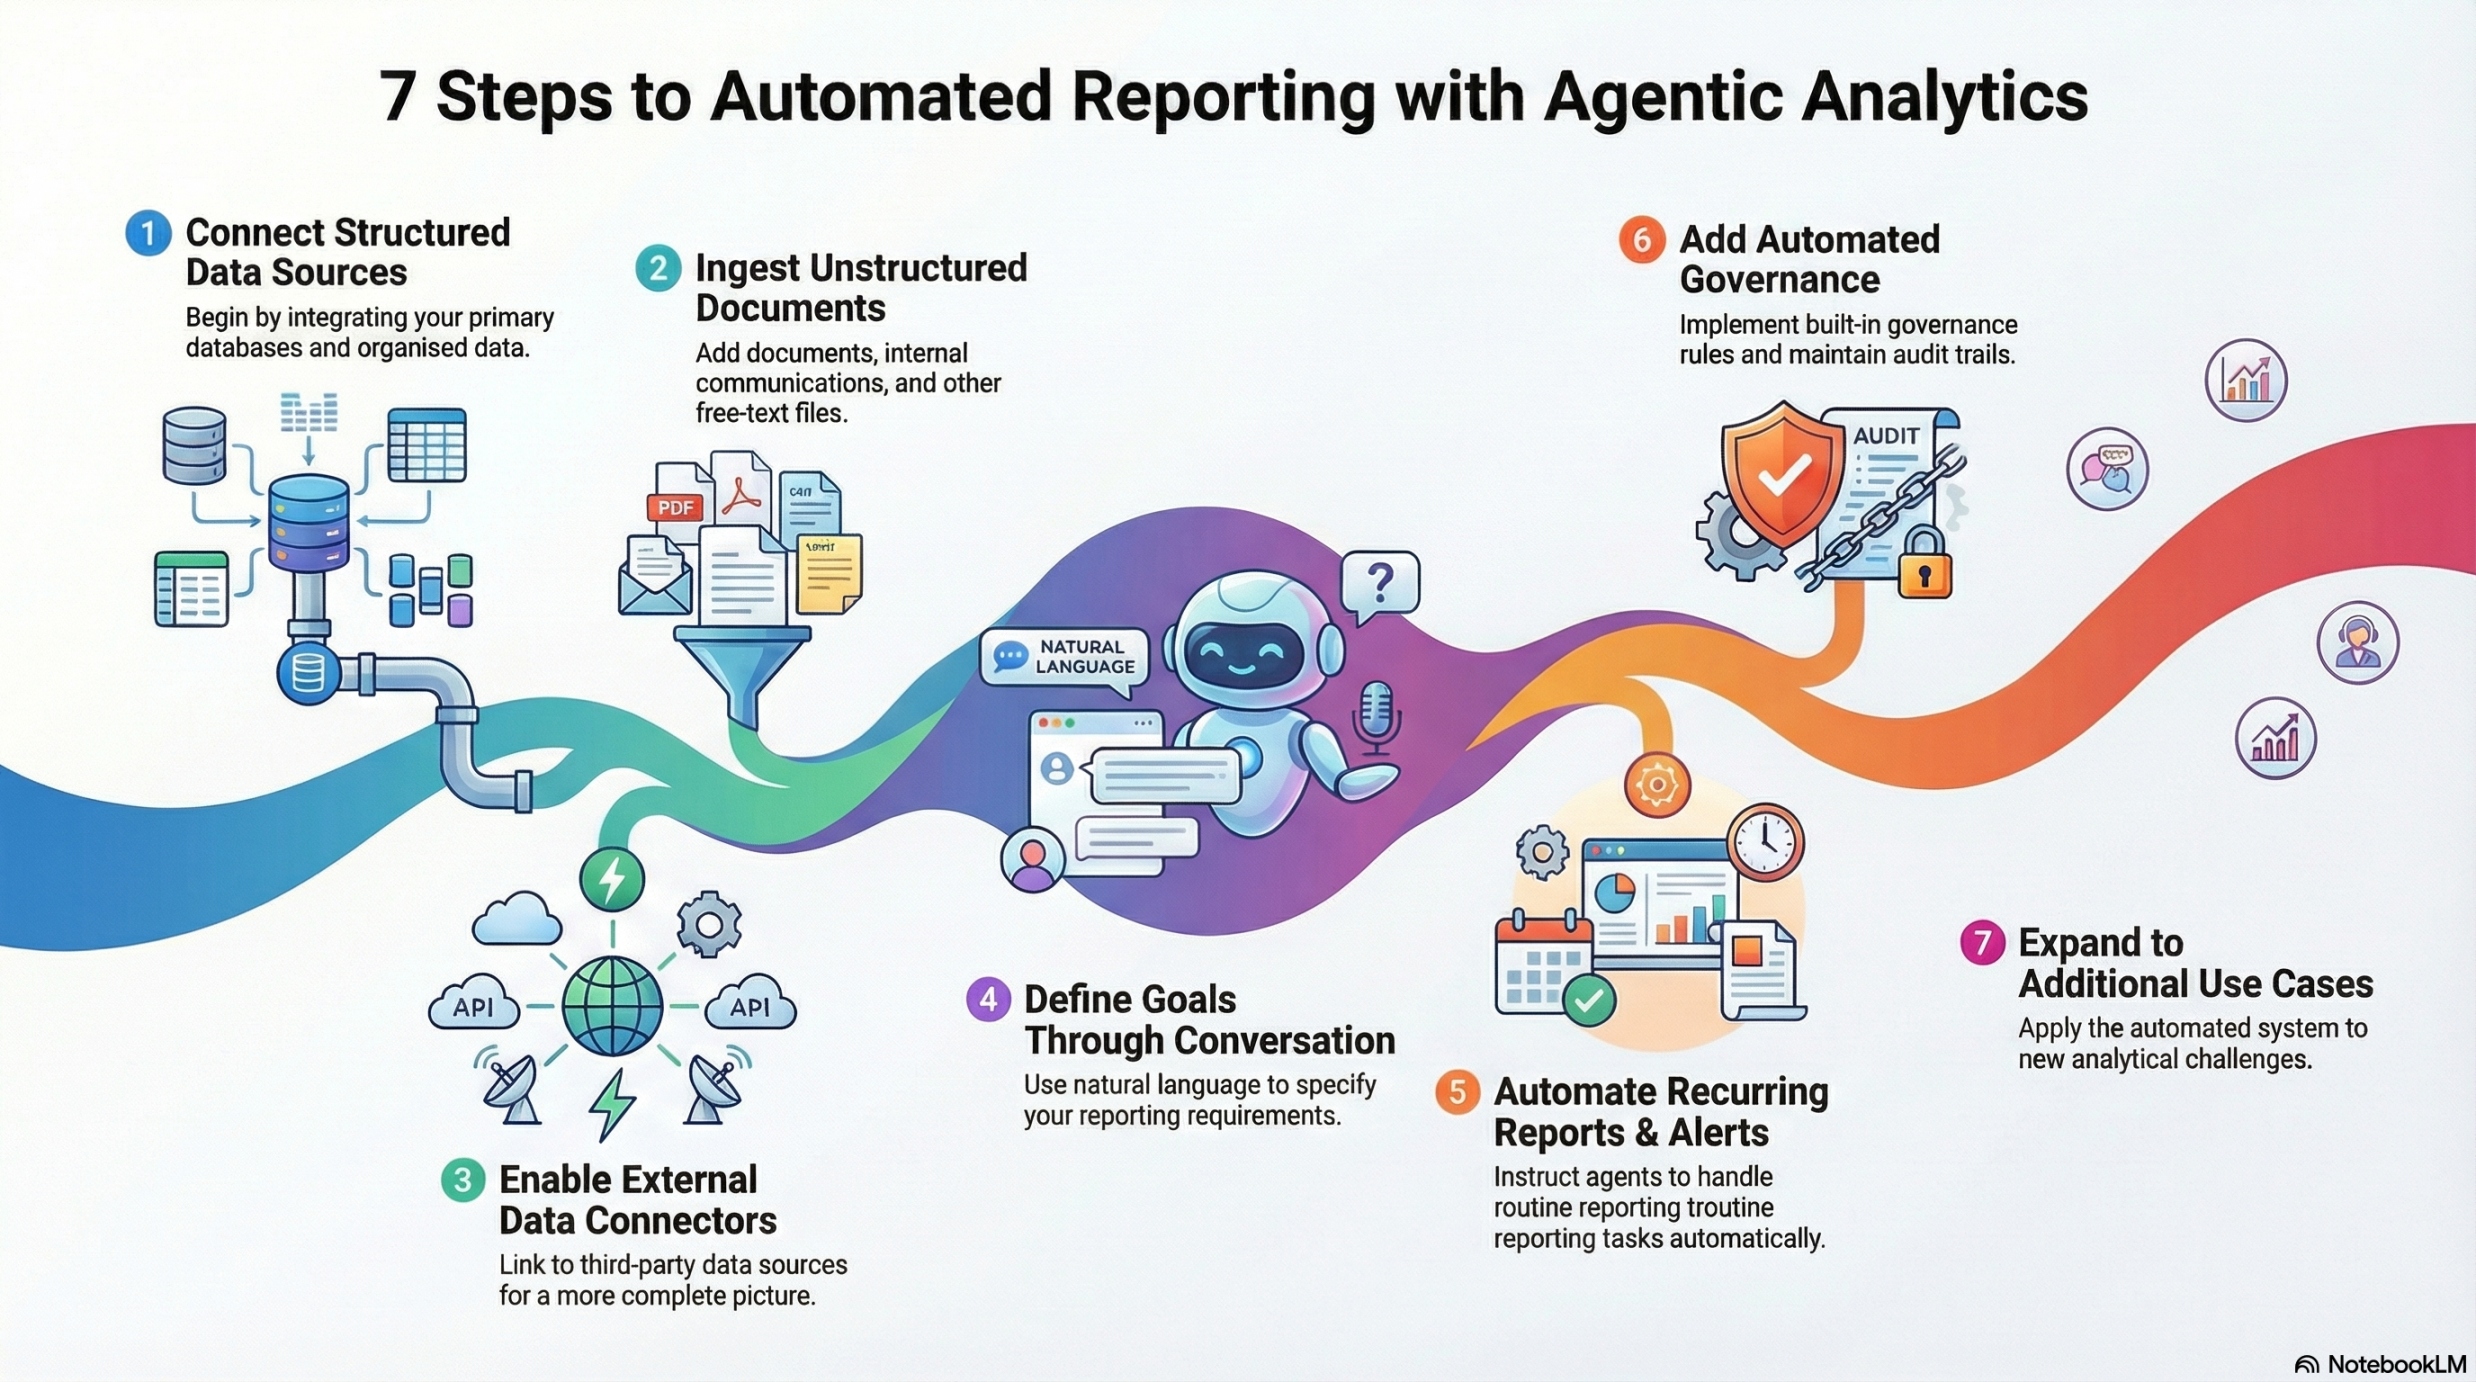
Step 1: Connect Your Structured Data Sources
Begin by integrating your existing databases. Connect your ERP system, CRM platform, point of sale systems, and any other structured data sources. This establishes the foundation.
Most agentic analytics platforms provide pre-built connectors for common enterprise systems. This step should take days, not months.
Step 2: Ingest Unstructured Documents and Communications
Next, start feeding the system your unstructured data. Upload historical documents. Connect to email systems. Integrate with collaboration platforms like Slack or Teams.
Include support ticket systems. The knowledge agents need access to this information to provide context for their analysis.
Step 3: Enable External Data Connectors
Configure connections to external data sources relevant to your business. This might include industry news feeds, competitor intelligence services, economic indicators, weather data, or social media monitoring. The specific sources depend on your industry and use cases.
Step 4: Define Reporting Goals Through Conversation
Use the natural language interface to tell the system what you need. "I want a weekly revenue report broken down by region and product line with automatic anomaly detection." The system understands your request and begins generating these reports automatically.
Step 5: Let Agents Handle Recurring Reports and Alerts
The system now operates autonomously. It generates your reports on schedule. It monitors for anomalies continuously. It investigates issues automatically. It sends alerts when human attention is needed. Your team receives finished analysis instead of raw data.
Step 6: Add Automated Governance and Audit Trails
Implement proper governance as you scale. Define which agents can take which actions. Set up approval workflows for significant decisions. Maintain comprehensive audit trails showing how the system reached each conclusion. This ensures accountability and compliance.
Step 7: Expand to Additional Use Cases
Start with one or two high-value use cases. Get them working well. Learn how the system operates. Then gradually expand to additional reporting needs. Most enterprises begin with financial reporting or sales analysis, then expand to operations, marketing, customer success, and other functions.
Security and Privacy
As enterprises adopt AI reporting tools to handle increasingly sensitive and diverse data, security and privacy become paramount. Leading AI reporting platforms are designed with robust security features, including compliance with industry standards such as SOC 2 Type II, TX-RAMP, and GDPR. These certifications ensure that your data is managed according to the highest security and privacy benchmarks.
Look for AI reporting tools that offer granular access controls, strong data encryption both in transit and at rest, and secure data storage solutions. Establish clear internal policies for data handling, storage, and disposal to further safeguard sensitive information throughout the reporting process.
Regular monitoring and auditing of your AI reporting systems are essential to detect and respond to potential security threats. By prioritizing security and privacy, organizations can confidently leverage AI reporting to generate valuable insights while maintaining trust and compliance with regulatory requirements.
Measuring Success with Agentic Analytics
To ensure your investment in AI reporting delivers real value, it’s crucial to measure success using clear, data-driven metrics. Begin by identifying key performance indicators (KPIs) that reflect your business objectives—such as reductions in manual effort, improvements in report accuracy, or faster decision making processes.
Agentic Analytics platforms make it easy to track these KPIs by monitoring metrics like report generation time, data quality, and user adoption rates. Regularly analyze the effectiveness of your generated reports to confirm they provide actionable insights that drive business outcomes.
Solicit feedback from stakeholders to identify areas for refinement and ensure that AI reporting continues to meet evolving business needs. By continuously measuring and optimizing your AI reporting processes with Agentic Analytics, your organization can achieve greater efficiency, unlock deeper insights, and realize sustained improvements in operational performance.
Choosing the Right Platform: What to Look For
Not all agentic analytics platforms are created equal. When evaluating solutions to automate reporting with AI, focus on these critical capabilities.
- Multi Agent Architecture: The platform should use multiple specialized agents that work together. Look for analytical agents, knowledge agents, and workflow orchestration.
- Broad Data Connectivity: Check what data sources the platform supports. You need connections to your specific databases, document repositories, collaboration tools, and external data sources. Pre-built connectors save massive implementation time.
- Natural Language Interface: The conversational layer should feel natural and maintain context across multiple turns. Test it with complex questions that require following up and refining.
- Governance and Security: The platform must provide role based access control, audit trails, and compliance features. Look for certifications relevant to your industry like SOC 2, HIPAA, or GDPR compliance.
- Action Execution Capabilities: Reporting without action is just with extra steps. The agentic dashboards platform should integrate with your business systems to execute decisions.
- Semantic Layer: This ensures everyone uses consistent definitions for business metrics. The semantic layer maps your business concepts to underlying data sources so reports remain accurate even as schemas change.
- Scalability: Consider both data volume and user count. The platform must handle your current needs and future growth.
- Customisation Options: Every enterprise has unique requirements. The platform should allow you to customize agents, workflows, and reporting templates to match your specific business processes.
Assistents.ai: The Agentic Analytics Platform Built for Enterprises
If you are serious about implementing autonomous reporting that actually works, Assistents.ai provides the complete agentic analytics platform designed specifically for enterprise needs.
Assistents.ai goes beyond traditional BI and simple conversational interfaces. The platform uses a multi-agent architecture that combines analytical agents, knowledge agents, and workflow orchestration to automate reporting with AI at every level.
What Makes Assistents.ai Different
It handles structured data from your databases, unstructured content from documents and communications, and external data from market sources. This means your reports finally use 100% of available information instead of just 10%.
The analytical agents continuously monitor your metrics, detect anomalies automatically, and perform multi step root cause analysis. They do not wait for you to ask what went wrong. They proactively investigate and explain.
The knowledge agents read through thousands of documents, emails, and logs to extract relevant context. They answer questions by finding information that would take humans days to locate manually.
Built for Enterprise Scale
Assistents.ai includes comprehensive governance features. Role-based access control ensures users only see data they are authorized to access. Audit trails track every analysis and decision. The semantic layer maintains consistent metric definitions across your organisation.
Get Started Today
Ready to change your enterprise reporting? Get a personalised demo that shows exactly how agentic analytics works with your specific data and use cases.
Visit Assistents.ai to schedule your demo and see how you can automate reporting with AI using truly autonomous analytics that deliver 10x faster insights and 171% average ROI.
FAQs
- What is the difference between agentic analytics and traditional business intelligence?
Traditional business intelligence provides static dashboards that visualise structured data. You must interpret the results manually. Agentic analytics uses autonomous AI agents that continuously monitor data, investigate issues automatically, combine structured and unstructured sources, and execute actions.
- How long does it take to implement agentic analytics in an enterprise?
Implementation timelines vary based on complexity, but most enterprises see initial value within 4 to 8 weeks. The process starts by connecting your primary data sources, which typically takes 1 to 2 weeks. Then you configure initial use cases and train the system on your business context, which takes another 2 to 3 weeks.
- Can agentic analytics integrate with our existing BI tools and data warehouse?
Yes, agentic analytics platforms are designed to work with your existing technology stack. They connect to your data warehouse, databases, and BI tools through APIs and standard connectors. You do not need to replace your current systems. Instead, agentic analytics layers on top, providing autonomous intelligence that complements your existing reporting infrastructure.
- What skills does our team need to use agentic analytics effectively?
One of the biggest advantages of agentic analytics is reducing technical skill requirements. Your business users interact through natural language conversations. They do not need to know SQL, write code, or understand complex data models. They simply ask questions in English and receive analyzed answers.
- How do we ensure governance and compliance with autonomous AI agents?
Enterprise agentic analytics platforms include comprehensive governance features. You define explicit rules about what actions agents can take and what data they can access. Role-based access control ensures users only see authorized information. All agent actions are logged in audit trails showing exactly how conclusions were reached.

Transform Your Business With Agentic Automation
Agentic automation is the rising star posied to overtake RPA and bring about a new wave of intelligent automation. Explore the core concepts of agentic automation, how it works, real-life examples and strategies for a successful implementation in this ebook.
Sarfraz Nawaz is the CEO and founder of Ampcome, which is at the forefront of Artificial Intelligence (AI) Development. Nawaz's passion for technology is matched by his commitment to creating solutions that drive real-world results. Under his leadership, Ampcome's team of talented engineers and developers craft innovative IT solutions that empower businesses to thrive in the ever-evolving technological landscape.Ampcome's success is a testament to Nawaz's dedication to excellence and his unwavering belief in the transformative power of technology.
More insights
Discover the latest trends, best practices, and expert opinions that can reshape your perspective


Contact us

