

Agentic Dashboards (2026): What They Are, How They Work, Architecture, Real Examples & Tools for Agentic Analytics


For years, dashboards acted like digital bulletin boards. They showed numbers, graphs and trends but waited for someone to come and look at them. The journey went from simple reports, to dashboard visuals, to chat-like analytics that answered questions in plain language.
Now the next shift is here. Dashboards are turning into something far more active. Instead of sitting quietly on a screen, they think, study signals, read documents, interpret what is happening, and carry out tasks through AI agents. This shift benefits business leaders by reducing manual workload and supporting proactive decision-making.
This new class is known as Agentic Dashboards, and they are becoming the front-door interface to Agentic Analytics and Agentic AI in Data Analytics.
They combine multi-agent reasoning, contextual data understanding, and action-taking ability that older BI tools never had. Agentic dashboards empower business users by providing direct, actionable insights without requiring technical expertise.
Let us break down what this actually means in simple language.
What Are Agentic Dashboards
An Agentic Dashboard is a dashboard that does not wait for you. It observes, analyzes, explains and takes actions using AI agents.
Think of it as having a small team of digital helpers who constantly watch your data, read documents, understand context and keep you ahead without you doing the manual work.
Agentic Dashboards follow the architecture described in the Assistents.ai system. They include:
- A multi-agent reasoning system, where different AI agents handle maths, documents, research and summaries
By leveraging these capabilities, agentic dashboards empower analytics teams to move beyond reactive analysis, enabling them to be more proactive, efficient, and insightful in their work.
- A fusion layer that combines structured tables, semi-structured logs, unstructured documents and external sources
- Continuous monitoring that tracks shifts across many input streams
- Action triggers driven by an agentic workflow controller that plans tasks, performs steps and takes an action through APIs
This is not a single AI feature. It is a coordinated system of different AI units working together.
How Agentic Dashboards Fit Into Agentic Analytics
Agentic dashboards serve as the interface layer of:
- Agentic Analytics
- Agentic BI
- Agentic Workflow Automation
- AI Agents for Analytics
They are not just for viewing information. They link insights and actions.
They support decision intelligence by letting AI connect findings to next steps.
They support autonomous analytics by allowing tasks to run without manual intervention.
Why Traditional Dashboards Are No Longer Enough
Dashboards were useful, but they stopped at showing information. As modern companies deal with more scattered data sources, typical dashboards fall short.
1. They Handle Only Structured Data
Most BI tools read tables. But modern companies hold far more scattered forms of information:
- Emails
- PDFs
- Chats
- Call transcripts
- Logs
- External feeds
According to the data reality section, unstructured information forms the majority of enterprise data. Traditional dashboards simply cannot read any of this.
2. They Show What Happened but Not Why
A BI chart can highlight a drop in revenue but cannot tell you:
- Customer complaints inside email threads
- Competitor price changes
- Product issues mentioned in chats
The “why” piece often sits in scattered sources that dashboards cannot read.
3. They Do Not Watch Things All the Time
Dashboards wait for people to check them. They cannot keep an eye on everything while you are away. They cannot read documents that arrive in the evening. They do not scan external feeds for competitor changes.
4. They Cannot Translate Insight Into Action
This is the greatest limitation. Traditional dashboards stop before the final leap. Even conversational BI stops at answers. A human still has to take the last action.
This last-mile barrier is exactly what Agentic Dashboards remove.
The Evolution From BI Dashboards to Agentic Dashboards
Analytics didn’t jump to agentic systems overnight. It moved through four clear phases, each solving one problem while revealing another.
1. Reporting
This was the starting point. Teams received static tables and PDF reports that showed what happened last week or last month. Everything was manual, slow and disconnected. If someone needed a new metric, a fresh report had to be created from scratch.
2. BI Dashboards
Dashboards brought charts, filters and visual summaries. They improved visibility and made data easier to consume. But they still read only structured data from warehouses. Anything inside emails, documents, chats, or external sources remained invisible, so leaders never got the full picture.
3. Conversational Analytics
This phase allowed people to ask questions in natural language. Instead of clicking through filters, users could ask “Why did churn rise?” and get a quick answer. Accessibility improved dramatically, but humans still had to interpret insights and take the next action manually. It made BI easier, not autonomous.
4. Agentic Dashboards
This is where the real leap happens. Agentic dashboards combine multiple agent types to:
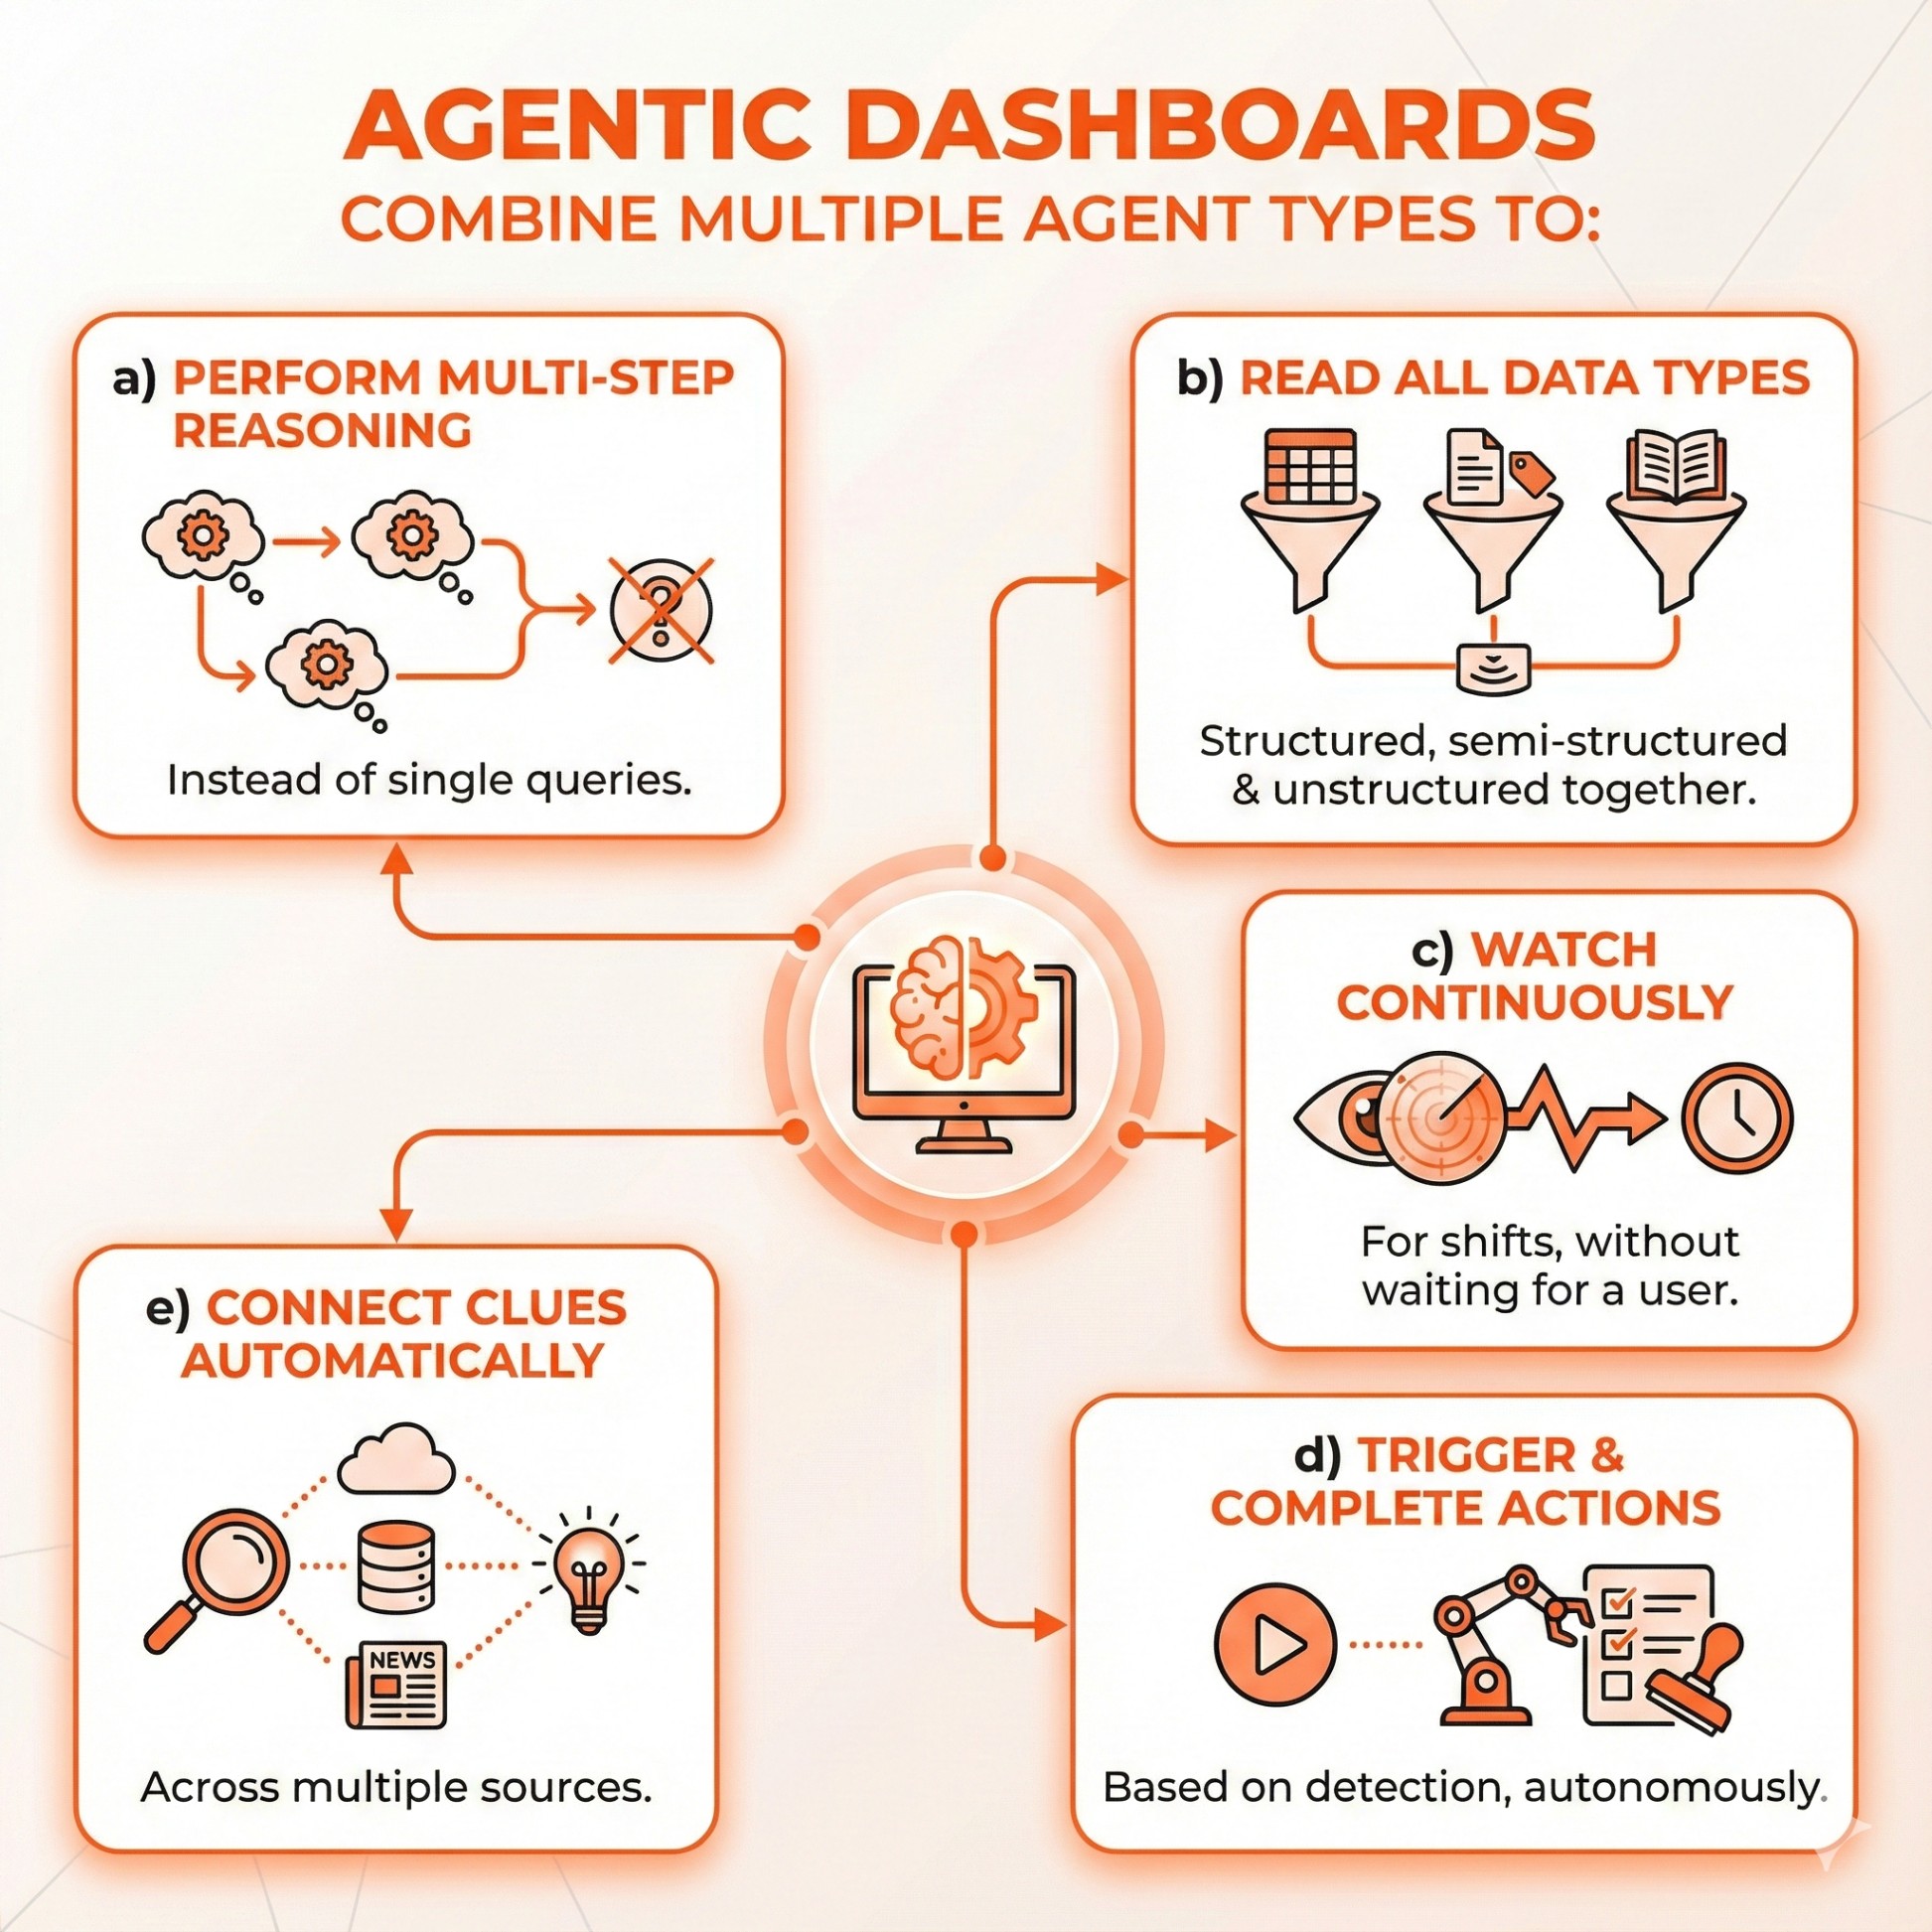
- perform multi-step reasoning instead of single queries
- read structured, semi-structured and unstructured data together
- watch for shifts continuously without waiting for a user
- trigger or complete actions based on what they detect
- connect clues across multiple sources automatically
Each stage improved decision-making, but agentic dashboards are the first to reduce human monitoring completely. They don’t wait for someone to ask “What changed?” They already know, and they’re ready to explain or act.
Core Components of an Agentic Dashboard
1. Contextual Data Fusion Layer
Agentic dashboards combine information from:
- Structured sources
- Semi-structured logs
- Unstructured documents
- External signals
The contextual fusion diagrams show how all formats flow into one combined insight layer .
This gives the dashboard a deeper view of what is actually happening.
2. Analytical Agents
These agents specialize in quantitative reasoning. They handle:
- Root cause analysis
- Trend projection
- Pattern recognition
3. Knowledge Agents
These agents read and understand text. They handle:
- Document analysis
- Semantic search
- External research
They can read PDFs, chats, notes and extract meaning.
4. Agentic Workflow Engine
This is the brain that coordinates everything.
It performs:
- Planning
- Task breakdown
- Delegation to agents
- Execution
- Final output combination
This engine allows a dashboard to behave like a mini operations unit.
5. Governance and Semantic Layer
The governance layer adds rules for:
- Access control
- Metric definitions
- Semantic understanding
- Audit logs
This supports trust and consistency.
How Agentic Dashboards Actually Work
1. Observation Phase
The dashboard keeps an eye on various sources like:
- Metrics
- Logs
- Documents
- Chats
- Market signals
- Competitor moves
- Customer sentiment
2. Analysis Phase
Analytical Agents study patterns such as:
- Unexpected dips
- Spikes in complaints
- Changes in product usage
- Repeated behaviours
- Likely causes in nearby data
3. Explanation Phase
The dashboard generates a clear narrative that connects:
- What happened
- Why it happened
- What other data sources reveal
- What next actions might solve the issue
It combines structured and unstructured insight into one logical explanation.
4. Action Phase
The agentic workflow engine can trigger actions automatically such as:
- Issue alerts
- Update CRM entries
- Adjust inventory levels
- Recalculate supply chain priorities
- Modify marketing triggers
- Raise internal tickets
- Send messages
- Pull external resources
Agentic dashboards close the loop. They do not stop at showing information. They move from insight to action.
Real Examples of Agentic Dashboards
1. Beginner Level
- “Explain why revenue dropped last month”: The dashboard checks sales data, support tickets, customer sentiment and competitor moves and provides a full explanation.
- Daily insight digest: Instead of manual scanning, the dashboard creates a morning brief.
2. Intermediate Level
- Customer churn analysis: It reads CRM data, supports ticket patterns and product usage to locate causes for churn.
- Operational issues detection: It connects order delays to supplier documents and warehouse logs.
3. Advanced Level
- Supply chain disruption detection: It reads external sources, vendor documents and internal logs to discover early signs of delays.
- Competitor movement monitoring: It picks up pricing changes, website updates and customer reactions.
4. Full Agentic Workflow Automation
Here the dashboard:
- Observes
- Reasons
- Decides
- Acts
For example, it can reorder items when stocks fall below a certain threshold or activate a campaign if customer sentiment drops.
Use Cases Across Industries
1. Financial Services
- Fraud detection alerts
- Risk monitoring with text documents
- Compliance checks using internal and external material
2. Retail and Ecommerce
- Competitor pricing patterns across external sources
- Demand projection based on reviews, chats and sales
- Return pattern understanding from support notes
3. Healthcare
- Doctor notes combined with patient metrics
- Treatment pattern recognition
- Critical event prediction from multiple data types
4. Manufacturing and Telecom
- Network anomaly detection
- Supply chain issue monitoring
- Quality issues based on production logs and complaints
Agentic Dashboard Architecture Breakdown
Based on the Assistents.ai architecture diagram, an agentic dashboard uses:
1. Data Ingestion Layer
Brings structured, semi-structured and unstructured information into the system.
2. Embedding and Vector Search Layer
Unstructured content is turned into embeddings that allow fast search and understanding.
3. Analytical and Knowledge Agents
Maths agents, document agents and research agents work together.
4. Orchestrator
This unit assigns and combines tasks.
5. Governance Layer
Controls access, maintains definitions and records activity.
6. Actions Rail
The system can send commands to CRM systems, marketing tools, inventory systems and more.
Agentic Dashboard Tools and Platforms in 2025
1. BI Vendors Adding Agentic Features
- Tableau Pulse
- Tableau Next
- Power BI Copilot
- Qlik Agentic Framework
2. AI First Platforms
These move closer to full agentic dashboards:
- Assistents.ai
- GoodData AI Hub
3. Analytics Automation Tools and AI Dashboards
- Sigma Ask
- ThoughtSpot Sage
- ThoughtSpot Spotter
- Databricks AI BI Genie
4. Enterprise AI Agents Ecosystem
- Snowflake Copilot
- Snowflake semantic model
Benefits of Agentic Dashboards
Agentic dashboards don’t stop at showing numbers. They stitch together every clue across structured data, documents, chats, logs and external signals to form a complete storyline.
Instead of jumping across tools to understand what happened, why it happened and how it affects the next move, users receive a single, connected explanation. This creates one continuous flow from observation to context to recommended action.
1. Multi Modal and Context Enriched
Modern business signals rarely live in one format. Agentic dashboards merge text, spreadsheets, PDFs, customer emails, market news and product logs into one unified context. This lets the system catch relationships that traditional BI tools miss. For example, a dip in sales might connect to negative ticket sentiment or a competitor announcement picked up from external sources. Multi-modal fusion gives the dashboard a much deeper sense of what’s happening behind the scenes.
2. Continuous Decisioning
Unlike traditional dashboards that wait quietly on a screen, agentic dashboards stay alert all day. They monitor every data stream—metrics, messages, documents, workflows—and spot early signs of a shift. They surface issues before someone asks, making decision cycles much faster. This “always awake” behaviour helps teams catch problems and opportunities earlier instead of reacting after the damage is done.
3. Autonomous Action Layer
Once the dashboard understands what is happening, it can also take the next logical step automatically. It can create tasks, escalate an issue, adjust thresholds, update records or notify teams without waiting for manual intervention. This removes repetitive work from humans and keeps processes moving. The system can act instantly within defined guardrails while still preserving full control and auditability for leadership.
Challenges and Considerations
Agentic dashboards operate across many data types and take actions without waiting for human instruction. This makes trust the biggest barrier for most teams. People want to know how the system arrived at a conclusion, which signals it used, and what logic drove the final recommendation or action.
1. Data Readiness
No agentic workflow can function well if key information remains scattered or inaccessible. Companies must connect structured databases, logs, files, communication systems, and external feeds so the dashboard has a complete picture. Gaps in ingestion cause blind spots, which can lead to weak or incomplete insights. Clean metadata, document indexing, semantic consistency, and authenticated API access play a crucial role in preparing the environment for accurate reasoning.
2. Adoption and Culture
Agentic dashboards feel different from BI tools, so teams need time to adjust. Instead of logging in to “check numbers,” users watch insights arrive proactively. Instead of manually searching for explanations, they receive ready-made narratives.
Some teams may resist at first because this model reduces manual control. Training sessions, internal champions, and showing early wins help shift the mindset from dashboards as static charts to dashboards as intelligent assistants that lighten workload instead of replacing expertise.
3. Infrastructure Complexity
Under the surface, agentic dashboards run through multiple layers: ingestion systems, vector search, semantic models, analytical agents, document agents, orchestration units, and workflow connectors. Coordinating all these parts requires careful architecture.
Companies need reliable pipelines, strong data governance, well-defined metrics, and robust integration standards. Without these foundations, the dashboard might reason inaccurately or fail to execute actions. Proper infrastructure creates stability so the agentic system can grow over time.
How to Get Started With Agentic Dashboards in Your Company?
1. Audit your current dashboards and data sources
Check where the blind spots exist; unstructured content, external signals, missing alerts, and no action layer.
2. Define 2–3 pilot use cases
Choose high-impact areas such as churn detection, fraud signals, supply chain delays, or revenue leakage.
3. Ensure you have access to key unstructured and external data sources
Emails, PDFs, call transcripts, chat logs and external feeds greatly sharpen agentic intelligence.
4. Pilot with an agentic platform (e.g., Assistents.ai)
Start narrow, automate one workflow end-to-end, and prove value fast.
5. Add governance early
Set approval flows, role-based access, audit logs and semantic definitions so actions happen safely.
The Future of Dashboards (2025 to 2030)
1. Dashboards Will Become Narrative Companions
Instead of visual charts, dashboards will generate conversational narratives that feel like talking to a colleague.
2. Dashboards Will Act Automatically
They will carry out tasks based on the insights they generate.
3. Agentic Dashboards May Replace Most Traditional Dashboards
Static charts will slowly lose importance.
4. Domain Specific Enterprise Agents Will Rise
Healthcare agents, finance agents, supply chain agents and many more will surface.
The Dashboard Is Becoming an Intelligent Partner
Agentic dashboards change how companies interact with information. They watch what is happening, make sense of it, connect clues across documents and data, and carry out actions. They bring together everything that analytics has been building toward.
If you want to experience this new category in practice, Assistents.ai is one of the strongest platforms that already supports multi agent reasoning, unstructured data understanding, contextual fusion and automated workflows.
Try Assistents.ai and see how agentic dashboards can support your team’s next step forward.
FAQs
1. What is an agentic dashboard?
A dashboard that observes, analyzes, explains and acts with AI agents.
2. How is it different from a BI dashboard?
BI dashboards show information. Agentic dashboards interpret and act on information.
3. Are agentic dashboards replacing traditional BI?
They are emerging as a more powerful dashboard form, especially for complex environments.
What tools support agentic dashboards?
Platforms like Assistents.ai, GoodData AI Hub and agent enabled versions of Tableau, Power BI and Qlik.
Are agentic dashboards safe for enterprise data?
With strong governance layers, role controls and audit logs, they can operate safely.

Transform Your Business With Agentic Automation
Agentic automation is the rising star posied to overtake RPA and bring about a new wave of intelligent automation. Explore the core concepts of agentic automation, how it works, real-life examples and strategies for a successful implementation in this ebook.
Sarfraz Nawaz is the CEO and founder of Ampcome, which is at the forefront of Artificial Intelligence (AI) Development. Nawaz's passion for technology is matched by his commitment to creating solutions that drive real-world results. Under his leadership, Ampcome's team of talented engineers and developers craft innovative IT solutions that empower businesses to thrive in the ever-evolving technological landscape.Ampcome's success is a testament to Nawaz's dedication to excellence and his unwavering belief in the transformative power of technology.
More insights
Discover the latest trends, best practices, and expert opinions that can reshape your perspective


Contact us

